Build your market map once.
Keep it current.
Turn your research into maps worth sharing. Organize the companies, choose your perspective, and keep every view connected to your data.
Request beta accessFree during beta · Access by invitation
One dataset. A different perspective.
AI infrastructure · Sample dataset
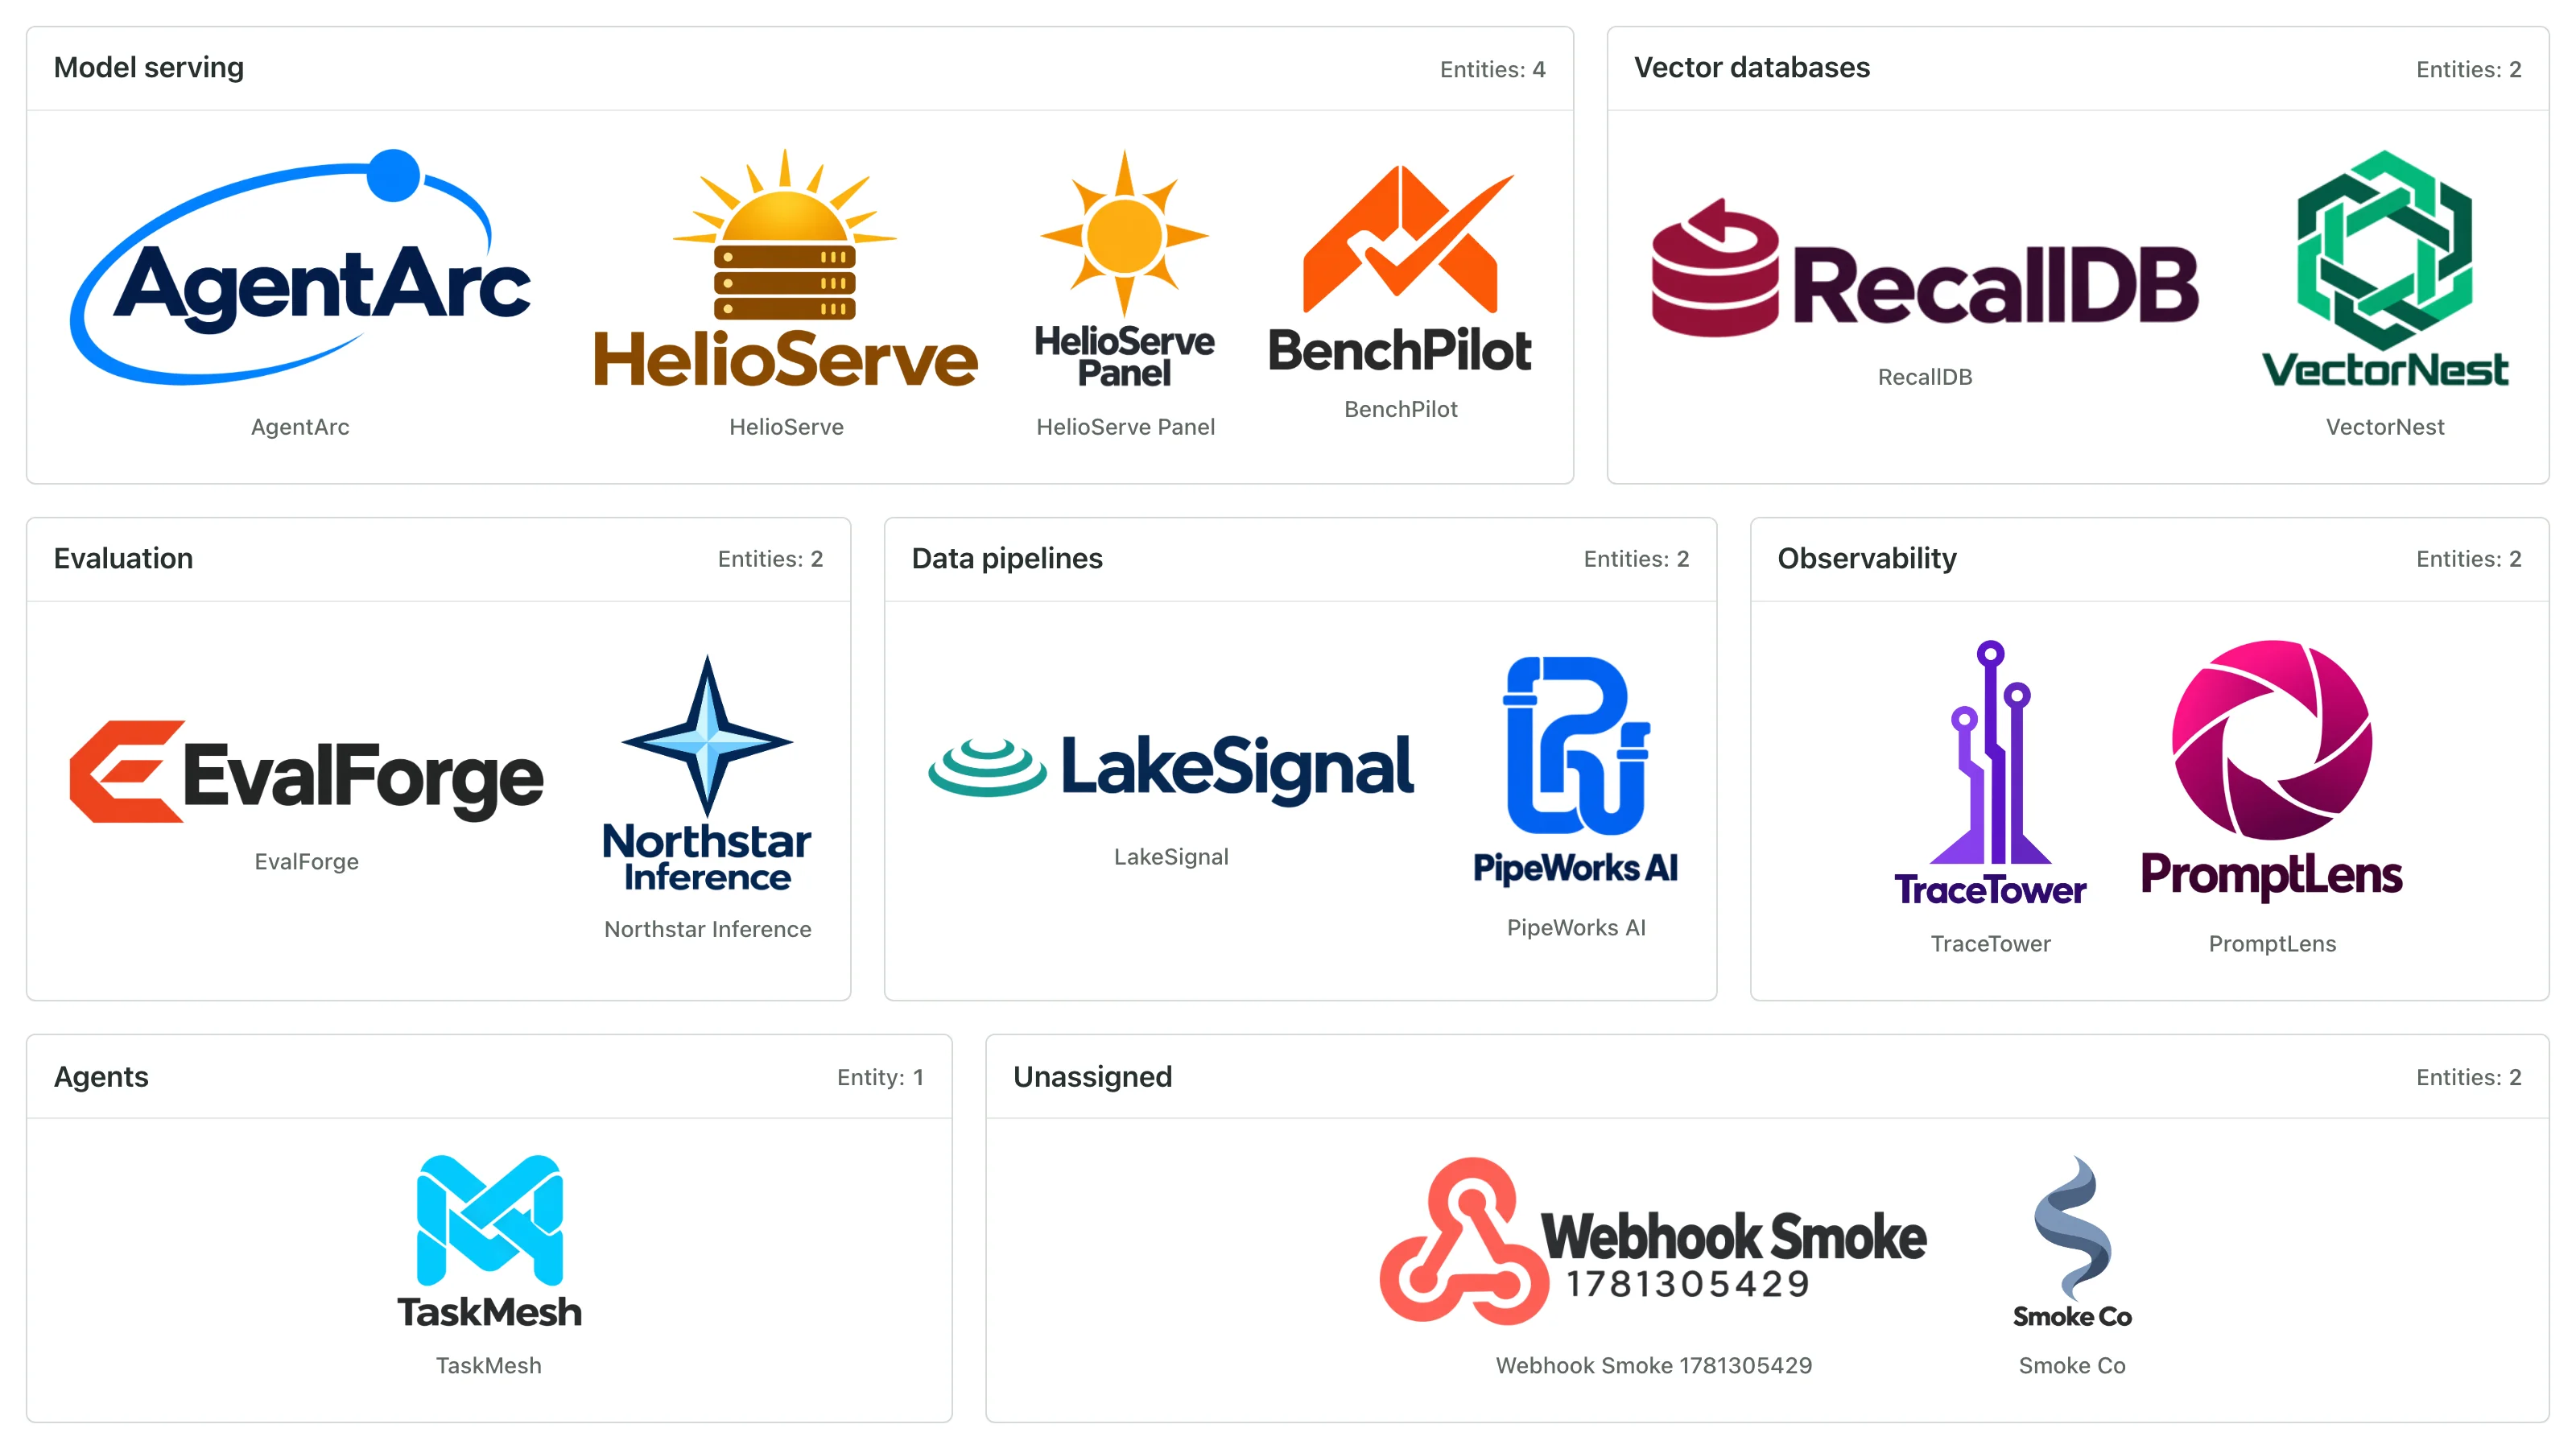
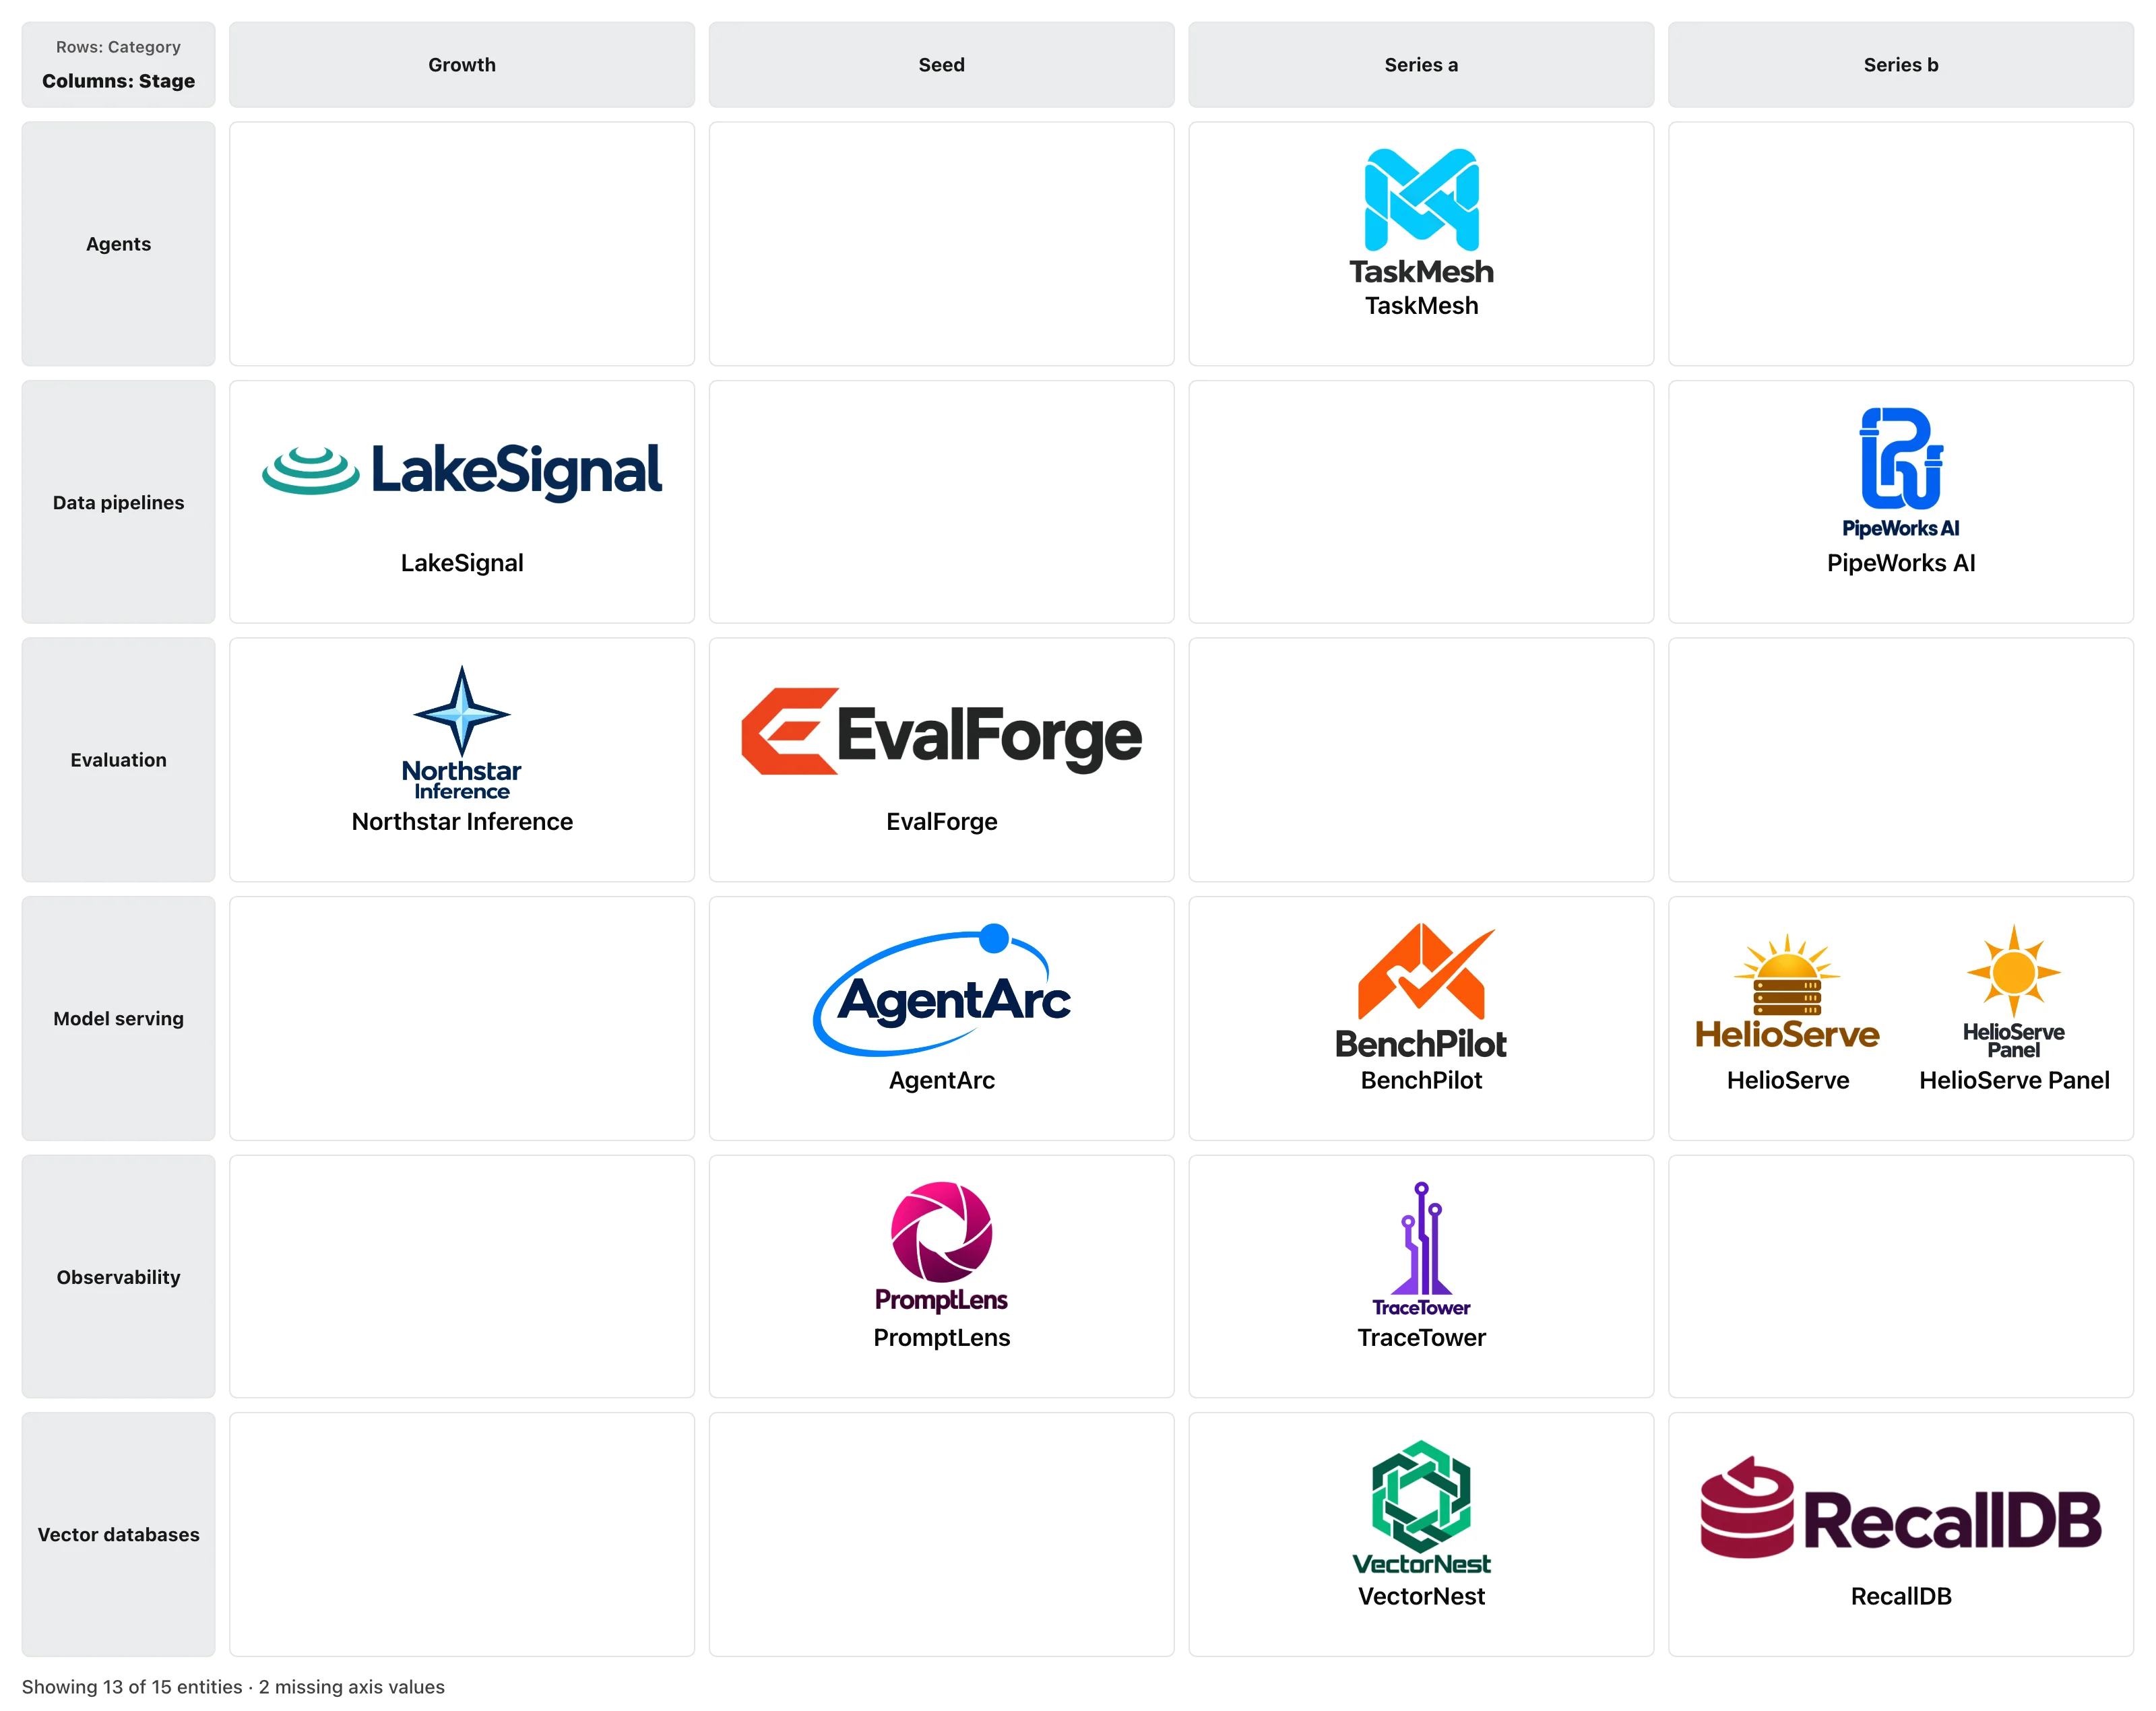
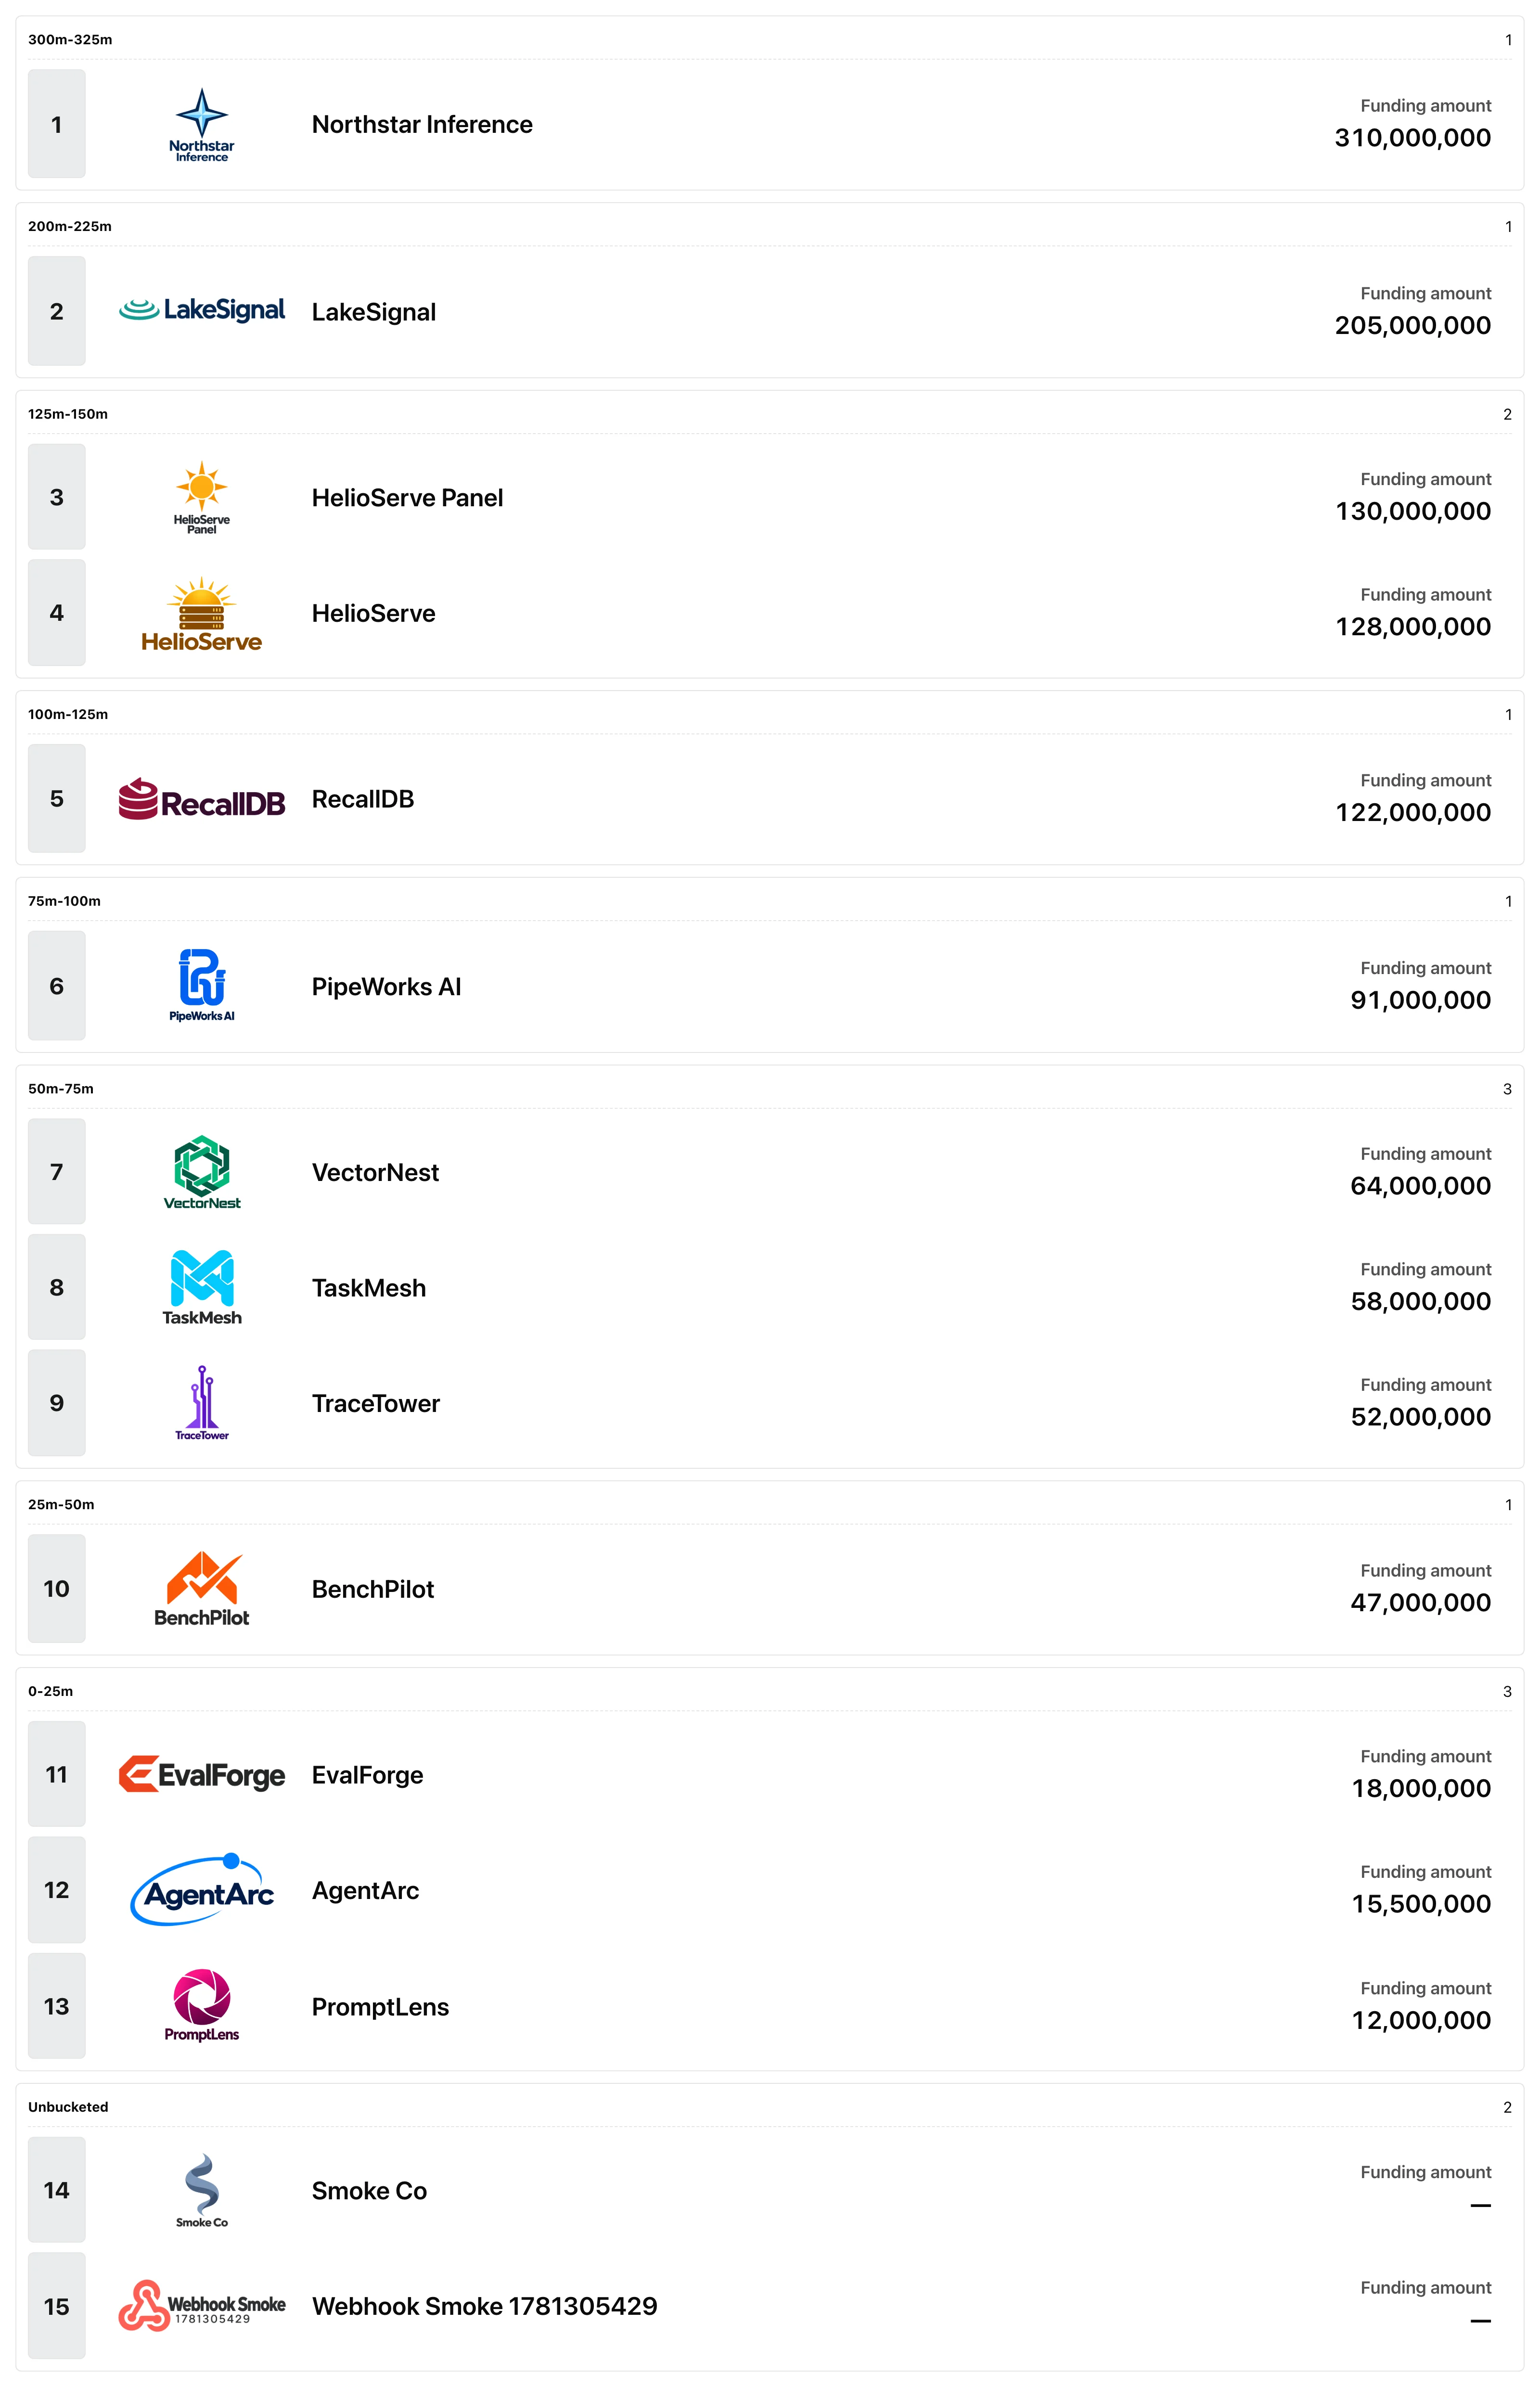
More time researching.
Less time rearranging.
A new company. A fresh funding round. A category that needs rethinking. Your map should be able to keep up.
Give your research a home.
Add companies, logos, and the attributes you care about. Keep the details together in one editable dataset.
Find the view that tells the story.
Group a market by category, compare two attributes in a matrix, or rank companies by a metric.
Update the data. Keep the map.
As your research changes, your views reflect it. Spend your effort on the insight, instead of placing logos again.
| Company | Category | Stage |
|---|---|---|
 AgentArc AgentArc | Model serving | Seed |
 VectorNest VectorNest | Vector databases | Series A |
 LakeSignal LakeSignal | Data pipelines | Growth |
One source of research. Multiple ways to see it.
A few things
you might be wondering.
Something else on your mind?
Get in touch
Who is PivotScapes for?
Anyone researching a landscape of companies, products, or projects. If you make market maps for investment research, a newsletter, a client, or your own strategy work, PivotScapes gives that research a place to live and evolve.
How is this different from making a map in a slide deck?
In PivotScapes, the map comes from your data. You maintain companies and their attributes, then choose how to group, compare, or rank them. Change the data and your views reflect it, without manually rearranging every logo.
Can I keep my research private?
Yes. You control which views you publish. A public view can be opened by anyone with its link; you can also make it private again. Keep your working research private and publish the views you want to share.
How can I share my maps?
Publish a view with a public link, embed it on a website, or export a PNG for a presentation or post. Public links and embeds show your live view; a PNG is a snapshot of your map when you export it.
Is the beta free?
Yes. The beta is free and access is being opened gradually. Request access and tell us what you would like to map. Paid plans are planned for later; pricing has not been announced.
Can I help shape what gets built?
Absolutely. Beta users can submit feature requests, vote on ideas, and report bugs through the app’s feedback board. Your real research workflow helps guide what we work on next.
What landscape
are you mapping next?
Join the free beta, bring a real project, and help shape what comes next. Request features and vote on ideas from inside the app.